Fig. 7
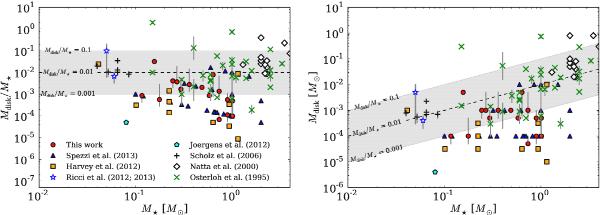
Disk mass to stellar mass ratio (left panel) and disk mass (right panel) as a function of stellar mass. On each panel, the shaded area represents log (Mdisk/M⋆) = −2 ± 1. Vertical gray lines correspond to uncertainties, when available. Data represented with green “×” symbols from Osterloh & Beckwith (1995), open black diamonds from (Natta et al. 2000, and references therein), dark “+” symbols are from Scholz et al. (2006), cyan hexagon from Joergens et al. (2012), open blue stars from Ricci et al. (2012, 2013), orange squares from Harvey et al. (2012a, Cha-I sample only), blue triangles from Spezzi et al. (2013, lower limits), and open red circles from this work. The color-coding in the right panel is the same as in the left panel. Filled symbols correspond to disk masses inferred from modeling of far-IR observations (this work; Joergens et al. 2012; Harvey et al. 2012a; Spezzi et al. 2013).
Current usage metrics show cumulative count of Article Views (full-text article views including HTML views, PDF and ePub downloads, according to the available data) and Abstracts Views on Vision4Press platform.
Data correspond to usage on the plateform after 2015. The current usage metrics is available 48-96 hours after online publication and is updated daily on week days.
Initial download of the metrics may take a while.