Fig. 2
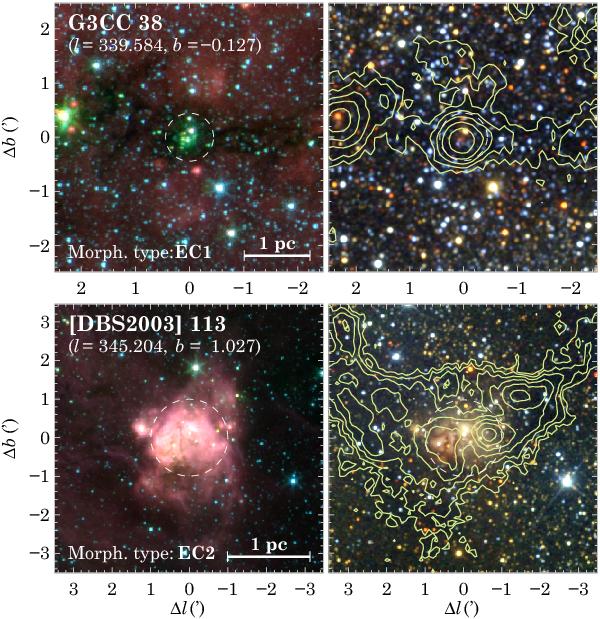
Examples of the two morphological types defined for ECs (see Sect. 4.1): cluster G3CC 38 of type EC1 (top panels), and the cluster [DBS2003] 113 of type EC2 (bottom panels). The left panels show Spitzer-IRAC three-color images made with the 3.6 (blue), 4.5 (green) and 8.0 μm (red) bands. The right panels present 2MASS three-color images of the same field of view, constructed with the J (blue), H (green), and Ks (red) bands. The overlaid contours on the 2MASS images represent ATLASGAL emission (870 μm); the contour levels are { 5,8.8,15,25,46,88,170 } × σ, where σ is the local rms noise level (σ = 45 mJy/beam for G3CC 38, and σ = 42 mJy/beam for [DBS2003] 113). The images are in Galactic coordinates and the given offsets are with respect to the cluster center, indicated in the left panels below the cluster name. The dashed circles represent the estimated angular sizes from the original cluster catalogs (see Sect. B.1). The 1 pc scale-bar was estimated using the corresponding distance adopted in our catalog.
Current usage metrics show cumulative count of Article Views (full-text article views including HTML views, PDF and ePub downloads, according to the available data) and Abstracts Views on Vision4Press platform.
Data correspond to usage on the plateform after 2015. The current usage metrics is available 48-96 hours after online publication and is updated daily on week days.
Initial download of the metrics may take a while.