Fig. 16
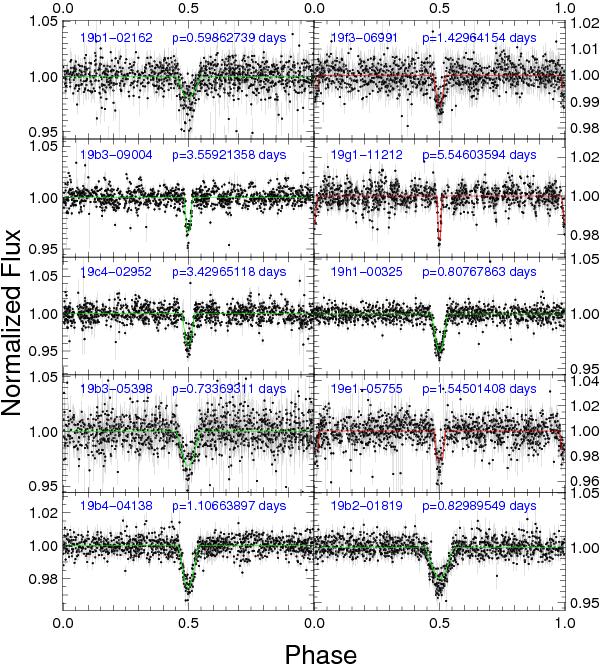
Phase-folded light curves of the ten candidates around F-G-K stars found in the WTS 19 h field. We overplot the best-fitting single eclipse transit models (green lines) for all objects for which the binary fit does not show an improvement over the single eclipse. The light curves with two eclipses are shown together with the best-fitting trapeziod model (red lines).
Current usage metrics show cumulative count of Article Views (full-text article views including HTML views, PDF and ePub downloads, according to the available data) and Abstracts Views on Vision4Press platform.
Data correspond to usage on the plateform after 2015. The current usage metrics is available 48-96 hours after online publication and is updated daily on week days.
Initial download of the metrics may take a while.