Fig. 15
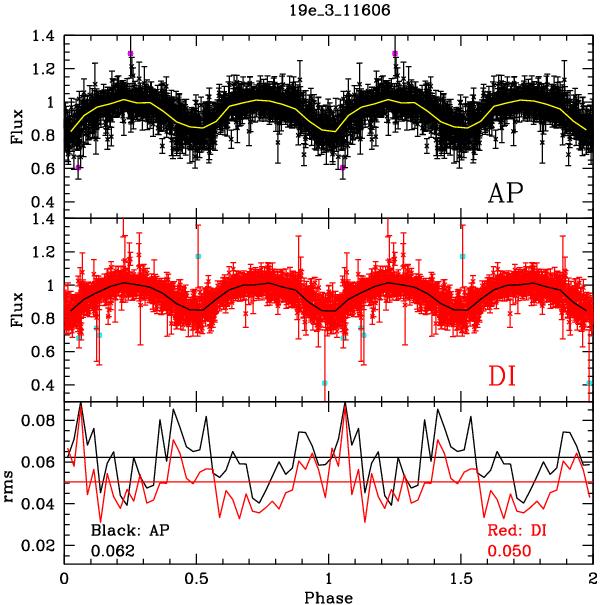
Comparison between the AP and DI light curves of an extremely-short period M-dwarf eclipsing binary system (19e-3-11606) found in the DI light curves. Black and red points in the upper two panels correspond to the AP and DI light curves, respectively. The yellow and black solid lines connect the median values in 40 bins with a size of 0.025 phase units. The lower panel shows the 4σ clipped rms of the residuals in each bin after subtracting the median. The horizontal lines represent the average rms of the residuals, which are 0.062 and 0.050 for the AP and DI light curves, respectively.
Current usage metrics show cumulative count of Article Views (full-text article views including HTML views, PDF and ePub downloads, according to the available data) and Abstracts Views on Vision4Press platform.
Data correspond to usage on the plateform after 2015. The current usage metrics is available 48-96 hours after online publication and is updated daily on week days.
Initial download of the metrics may take a while.