Fig. 1
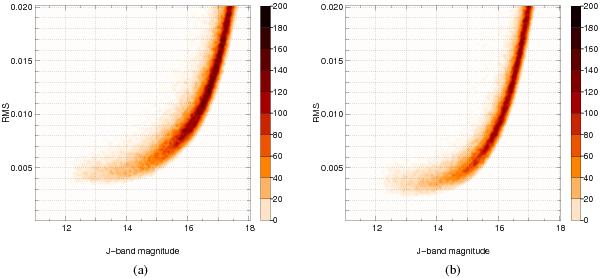
Quantitative comparison between different photometric analyses. The figure shows the rms of the DI and AP light curves (panels a) and b), respectively) as a function of the J-band magnitude. The rms corresponds to the measurements obtained after removing systematic effects. The plot is displayed in density of data points in a scale of 100 bins.
Current usage metrics show cumulative count of Article Views (full-text article views including HTML views, PDF and ePub downloads, according to the available data) and Abstracts Views on Vision4Press platform.
Data correspond to usage on the plateform after 2015. The current usage metrics is available 48-96 hours after online publication and is updated daily on week days.
Initial download of the metrics may take a while.