Fig. 9
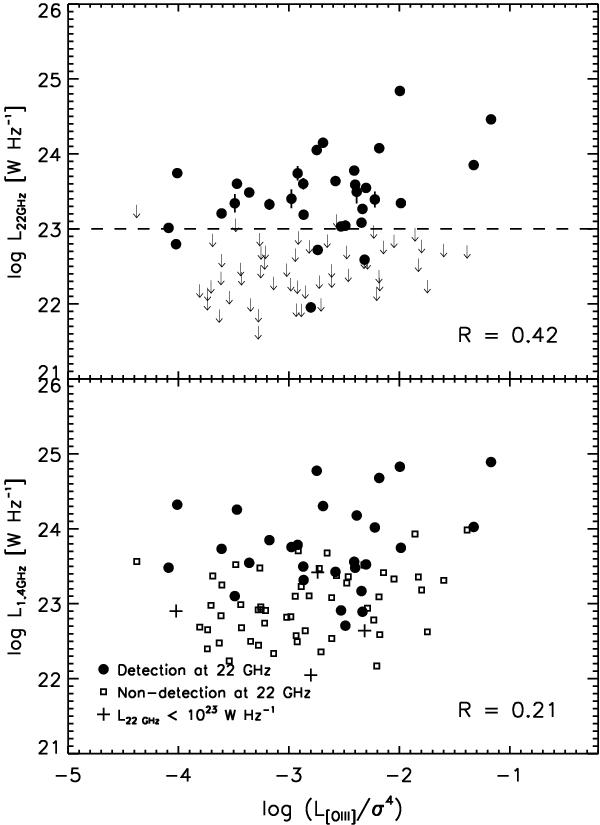
Relation between radio luminosity and the Eddington ratio for bright and detected galaxies at 22 GHz. Filled circles and open squares indicate the detected and non-detected galaxies at 22 GHz. The crosses represent the detected galaxies, but with L22 GHz < 1023 W Hz-1. The correlation coefficients are derived from the sample of bright L22 GHz > 1023 W Hz-1 and detected galaxies at 22 GHz.
Current usage metrics show cumulative count of Article Views (full-text article views including HTML views, PDF and ePub downloads, according to the available data) and Abstracts Views on Vision4Press platform.
Data correspond to usage on the plateform after 2015. The current usage metrics is available 48-96 hours after online publication and is updated daily on week days.
Initial download of the metrics may take a while.