Fig. 4
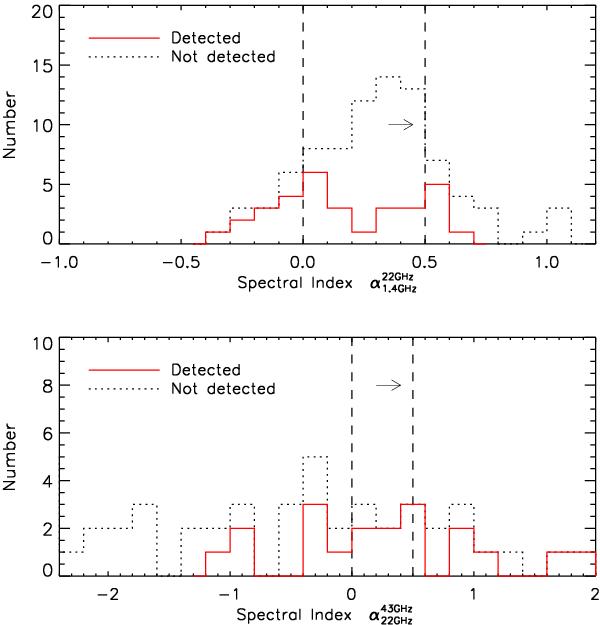
Spectral index distribution. Distributions between 1.4 and 22 GHz (top) and between 22 and 43 GHz (bottom). The red solid line represents the detected galaxies at 22 (top) and at 43 GHz (bottom). Black dotted lines represent non-detected galaxies. The arrows in each panel indicate the lower limit of spectral indices for non-detected galaxies. Galaxies can be divided into three groups according to spectral index: steep (α > 0.5), flat (0 < α < 0.5), or inverted (α < 0) spectra.
Current usage metrics show cumulative count of Article Views (full-text article views including HTML views, PDF and ePub downloads, according to the available data) and Abstracts Views on Vision4Press platform.
Data correspond to usage on the plateform after 2015. The current usage metrics is available 48-96 hours after online publication and is updated daily on week days.
Initial download of the metrics may take a while.