Fig. 5
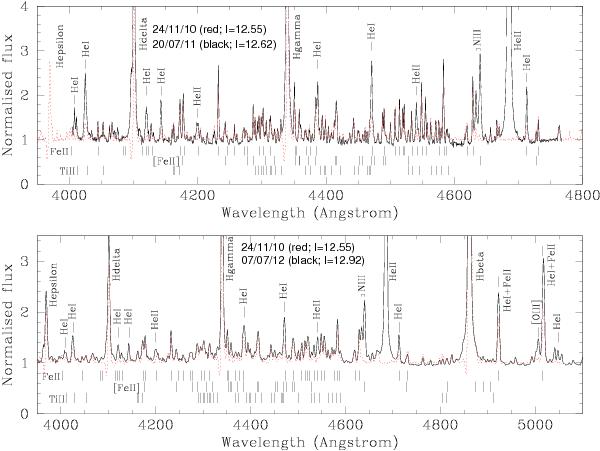
Comparison of blue-end optical spectra obtained in 2010 November, 2011 July and 2012 July, after the resolution of the former has been degraded to match that of the latter two spectra (which themselves differ in resolution and wavelength coverage; Sect. 2). Prominent transitions are indicated as are the I-band magnitudes on the dates of the observations. Following the line identifications of Zickgraf et al. (1989), additional weak emission lines from low excitation metallic species such as Ca i, Cr ii, Fe i, [S ii], Si ii and V ii are not shown for reasons of clarity.
Current usage metrics show cumulative count of Article Views (full-text article views including HTML views, PDF and ePub downloads, according to the available data) and Abstracts Views on Vision4Press platform.
Data correspond to usage on the plateform after 2015. The current usage metrics is available 48-96 hours after online publication and is updated daily on week days.
Initial download of the metrics may take a while.