Free Access
Fig. 3
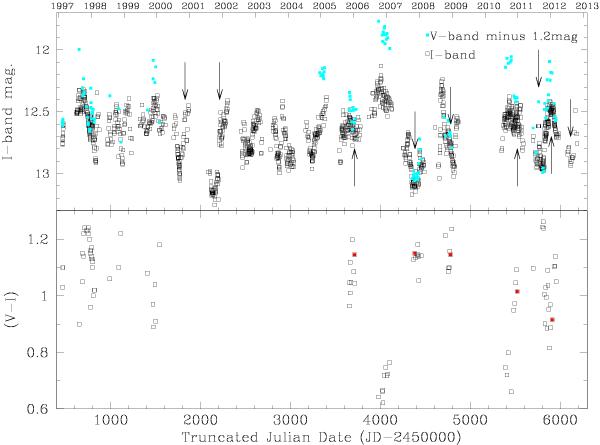
V- and I-band OGLE lightcurves (with the V-band displaced by 1.2 mag to enable easy comparison) and (V − I) colour index against time. Timings of optical spectroscopic observations indicated by arrows and (V − I) data within 9 d of an observation indicated by the red symbols (with the first four data points within 3 d).
Current usage metrics show cumulative count of Article Views (full-text article views including HTML views, PDF and ePub downloads, according to the available data) and Abstracts Views on Vision4Press platform.
Data correspond to usage on the plateform after 2015. The current usage metrics is available 48-96 hours after online publication and is updated daily on week days.
Initial download of the metrics may take a while.