Fig. 1
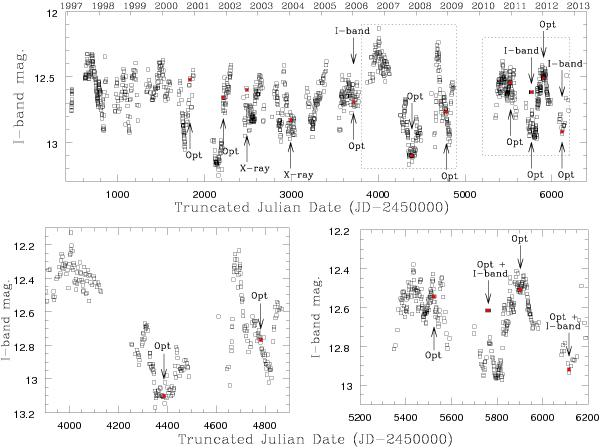
Top panel: 1997–2012 OGLE-II, -III and -IV lightcurve data for LHA 115-S 18 with the timings of optical blue- (Massey & Duffy 2001; Torres et al. 2012 and this work) and far-red (Aret et al. 2012 and this work) spectroscopic and X-ray (Antoniou et al. 2009; Bartlett et al., in prep.) observations indicated. The nearest photometric data points to each observation are given by the filled red symbols. Note that the spectrum of Massey & Duffy and the first epoch of Torres et al. were obtained quasi-simultaneously and the date indicated for the first X-ray observation is the midpoint of the period over which observations were made. Photometric errors are smaller than the symbol size plotted. Lower panels: expanded presentation of two sub-sections of the lightcurve (indicated by dotted lines in the upper panel).
Current usage metrics show cumulative count of Article Views (full-text article views including HTML views, PDF and ePub downloads, according to the available data) and Abstracts Views on Vision4Press platform.
Data correspond to usage on the plateform after 2015. The current usage metrics is available 48-96 hours after online publication and is updated daily on week days.
Initial download of the metrics may take a while.