Fig. 7
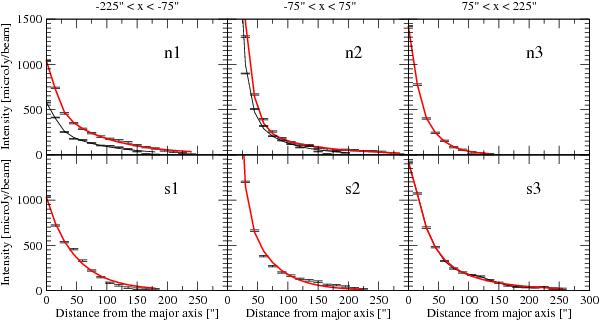
Total radio intensity profiles of the merged radio maps in μJy/beam perpendicular to the major axis of NGC 4631. The measured points are averaged in strips of 150′′ width along the major axis. The x-axis of the plots give the distance from the major axis in [′′]. The upper panels refer to the northern part (i.e., above the major axis) and the lower panels to the southern part (i.e., below the major axis) of NGC 4631. The thick red lines represent the two-component exponential fit to the data at 4.85 GHz; the thin black lines in n1 and n2 represent the fit to the 8.35 GHz data.
Current usage metrics show cumulative count of Article Views (full-text article views including HTML views, PDF and ePub downloads, according to the available data) and Abstracts Views on Vision4Press platform.
Data correspond to usage on the plateform after 2015. The current usage metrics is available 48-96 hours after online publication and is updated daily on week days.
Initial download of the metrics may take a while.