Fig. 7
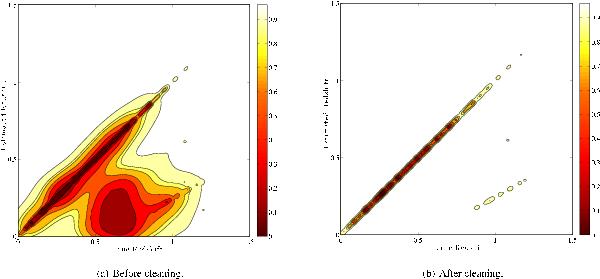
A contour plot to show the effect on redshift estimation a) before and b) after cleaning a catalogue which is at a signal-to-noise of 2.0, and cleaned with an FDR threshold of 4.55% allowed false detections. Contours indicate the fraction of points enclosed within them. Just under two thirds of all the estimated redshifts lie on the diagonal (and are thus correct) before cleaning being applied. Clearly outliers still exist after cleaning of the catalogue (off-diagonal), where the redshift estimation has failed, but as it can be seen, these are very few, and the result has a high certainty, with 94.9% of the estimates being correct. The capture rate for this catalogue and at this FDR threshold is 76.2%.
Current usage metrics show cumulative count of Article Views (full-text article views including HTML views, PDF and ePub downloads, according to the available data) and Abstracts Views on Vision4Press platform.
Data correspond to usage on the plateform after 2015. The current usage metrics is available 48-96 hours after online publication and is updated daily on week days.
Initial download of the metrics may take a while.