Fig. 6
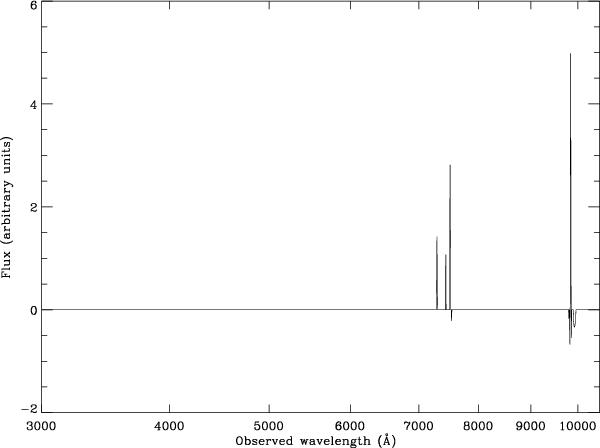
Result of denoising the positive and negative sections (shown together) of the spectrum shown in Fig. 5a with positivity and negativity constraints respectively. Note the reduced ringing, which leads to a more representative result with respect to the number of true features. Once again the FDR denoising of our noisier example (Fig. 5b) yields a null spectrum (not shown), and would thus result in the discarding of this spectrum from the redshift analysis.
Current usage metrics show cumulative count of Article Views (full-text article views including HTML views, PDF and ePub downloads, according to the available data) and Abstracts Views on Vision4Press platform.
Data correspond to usage on the plateform after 2015. The current usage metrics is available 48-96 hours after online publication and is updated daily on week days.
Initial download of the metrics may take a while.