Fig. 4
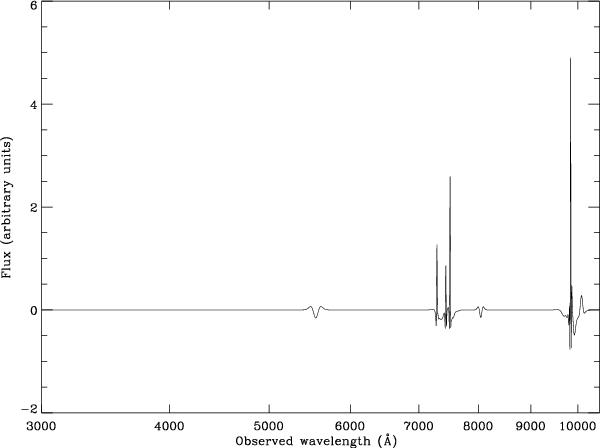
Result of an unrestricted denoising of the spectrum in Fig. 3a with an FDR threshold corresponding to an allowed rate of false detections of α = 4.55%. The [O III] doublet, Hα and Hβ are all cleanly identified. There are small features corresponding to [O II] and [S II], and a spurious feature at just over 8000 Å. The FDR denoising of Fig. 3b fails to detect any features for this particular spectrum, noise-realisation and choice of FDR threshold, and thus returns a null spectrum (not shown).
Current usage metrics show cumulative count of Article Views (full-text article views including HTML views, PDF and ePub downloads, according to the available data) and Abstracts Views on Vision4Press platform.
Data correspond to usage on the plateform after 2015. The current usage metrics is available 48-96 hours after online publication and is updated daily on week days.
Initial download of the metrics may take a while.