Fig. 3
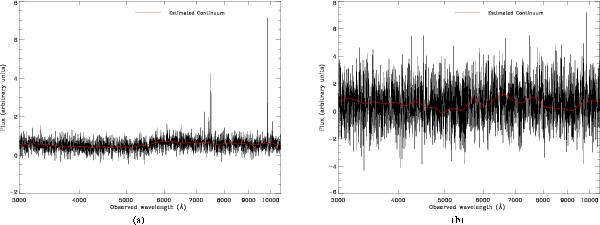
Same as in Fig. 2 but with manually added white-Gaussian noise at a signal-to-noise level in the r-band of 5 in a), and of 1 in b). The red lines indicate the empirically-determined continua in each case. Many of the prominent lines are easily visible by eye at the higher S/N of 5, whereas at the lower S/N of 1 most of the lines are obscured, with only Hα being sufficiently prominent so as to be detectable. The continuum estimate is good at the S/N of 5, and comparatively poor, but of the correct order of magnitude, at the lower S/N due to the dominating influence of noise. As an indication of line-S/N, we quote the values for the S/N on Hα for these particular spectra as 8.9 and 1.7 respectively for a) and b).
Current usage metrics show cumulative count of Article Views (full-text article views including HTML views, PDF and ePub downloads, according to the available data) and Abstracts Views on Vision4Press platform.
Data correspond to usage on the plateform after 2015. The current usage metrics is available 48-96 hours after online publication and is updated daily on week days.
Initial download of the metrics may take a while.