Fig. 13
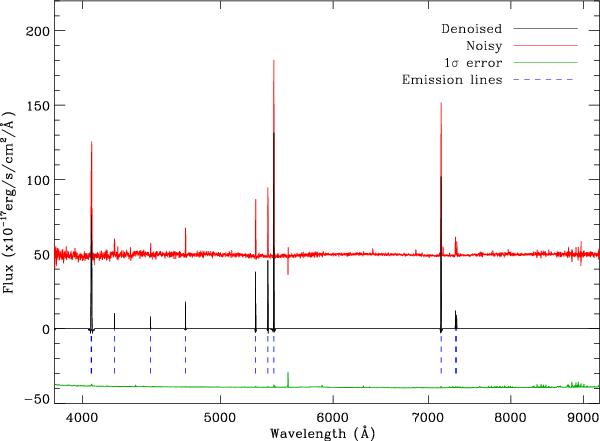
Denoising and feature extraction for an SDSS ELG. The noisy spectrum (red) has been shifted up, and the error-curve (green) shifted down, for clarity. The vertical dashed lines (blue) indicate the locations of detected features that correspond to true emission features. The FDR denoising and feature extraction clearly pinpoints all of the major features without any difficulty. The three largest lines are, from left to right, the [O II] doublet, [O III] and Hα.
Current usage metrics show cumulative count of Article Views (full-text article views including HTML views, PDF and ePub downloads, according to the available data) and Abstracts Views on Vision4Press platform.
Data correspond to usage on the plateform after 2015. The current usage metrics is available 48-96 hours after online publication and is updated daily on week days.
Initial download of the metrics may take a while.