Fig. 10
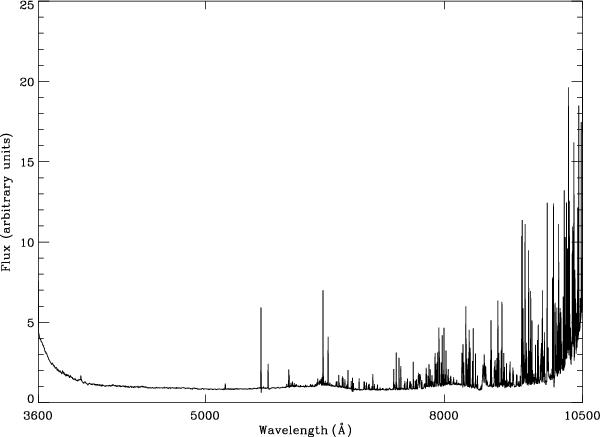
A realistic error-curve, where the resolution and binning are the same as for our mock catalogue, but with the wavelength range being slightly shorter, in order to be more proximal to the wavelength range of a realistic instrument. Gaussian noise is added to each pixel in our simulated data, with a standard deviation given by the value of the error-curve at that same pixel.
Current usage metrics show cumulative count of Article Views (full-text article views including HTML views, PDF and ePub downloads, according to the available data) and Abstracts Views on Vision4Press platform.
Data correspond to usage on the plateform after 2015. The current usage metrics is available 48-96 hours after online publication and is updated daily on week days.
Initial download of the metrics may take a while.