Fig. 5
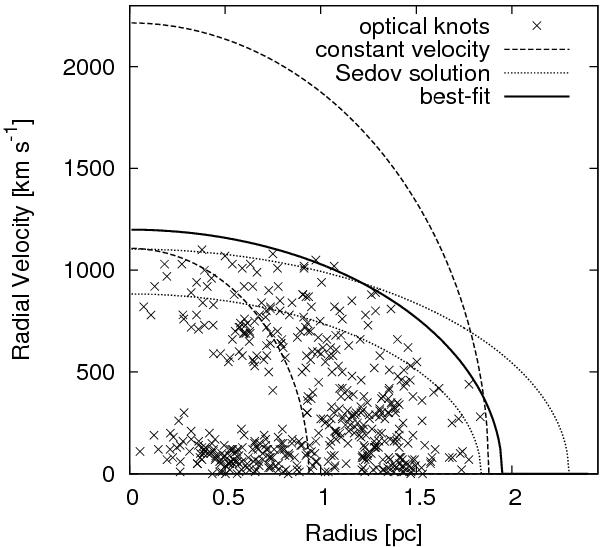
Plot of the optical knots found by Fesen et al. (2008) in a radius-velocity diagram. The radius is the distance of the knots from the central pulsar projected to the plane of the sky, assuming a distance of 2 kpc for 3C 58. The observed absolute radial velocity is shown on the y-axis. The dashed line represents the outer edge of this distribution assuming no deceleration since birth and a connection to SN 1181. The dotted line represents the outer edge of this distribution for Sedov expansion (Sedov 1959) and a connection to SN 1181. The solid line represents the best-fit outer edge of this distribution.
Current usage metrics show cumulative count of Article Views (full-text article views including HTML views, PDF and ePub downloads, according to the available data) and Abstracts Views on Vision4Press platform.
Data correspond to usage on the plateform after 2015. The current usage metrics is available 48-96 hours after online publication and is updated daily on week days.
Initial download of the metrics may take a while.