Fig. 2
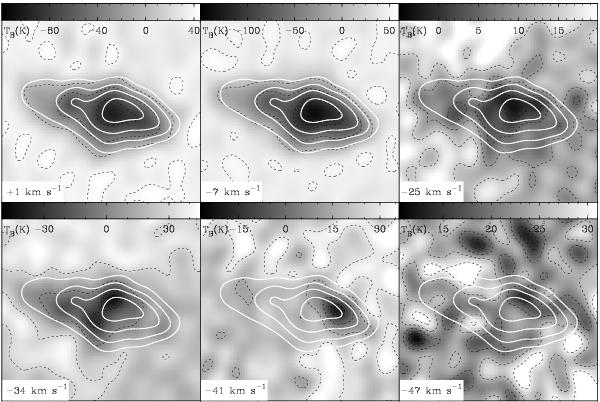
H i channel maps of 3C 58 taken at the peaks in the absorption spectra at +1 (top left), −7 (top centre), −34 (bottom left), and −41 km s-1 (bottom centre). The right panels show ten channels averaged over the inter-arm velocities between the Local and Perseus arm (top) and ten channels averaged over the velocities just outside the last absorption feature. The continuum emission of 3C 58 is indicated by the white contours. The black dashed lines represent the H i contours at the levels indicated by the labels of the colour bars.
Current usage metrics show cumulative count of Article Views (full-text article views including HTML views, PDF and ePub downloads, according to the available data) and Abstracts Views on Vision4Press platform.
Data correspond to usage on the plateform after 2015. The current usage metrics is available 48-96 hours after online publication and is updated daily on week days.
Initial download of the metrics may take a while.