Fig. 3
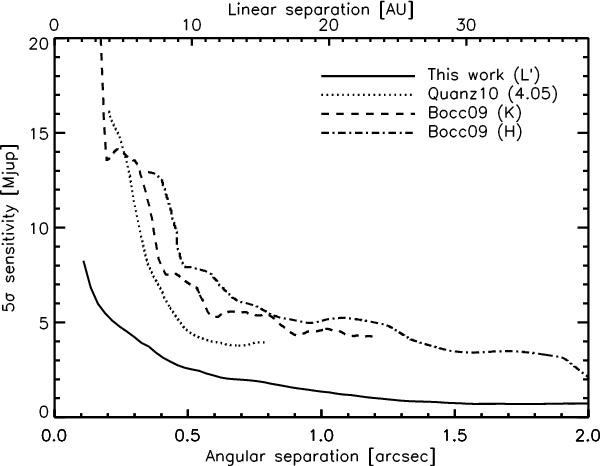
Sensitivity limits in terms of mass derived from our data set (solid line), compared with the results of Boccaletti et al. (2009, dashed and dash-dotted) and Quanz et al. (2010, dotted) using the same evolutionary models (see text). This figure cannot serve as a direct comparison between the sensitivity of these NACO observing modes, as ADI was not used in the three previously published data sets.
Current usage metrics show cumulative count of Article Views (full-text article views including HTML views, PDF and ePub downloads, according to the available data) and Abstracts Views on Vision4Press platform.
Data correspond to usage on the plateform after 2015. The current usage metrics is available 48-96 hours after online publication and is updated daily on week days.
Initial download of the metrics may take a while.