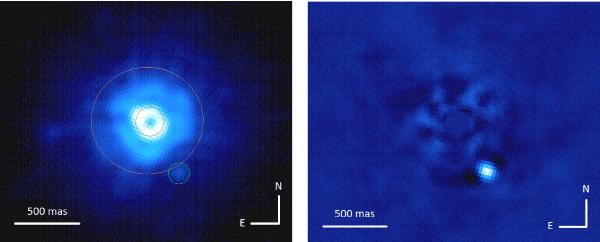
Fig. 1

Left: illustration of an individual image of the cleaned cube (log scale), showing that the companion can be readily identified without further image processing (cf. green circle). The region used for frame selection is located between the two brown circles. Right: final reduced image obtained as the median of the de-rotated sPCA-processed cleaned cube (linear scale). North is up and east to the left in both images.
Current usage metrics show cumulative count of Article Views (full-text article views including HTML views, PDF and ePub downloads, according to the available data) and Abstracts Views on Vision4Press platform.
Data correspond to usage on the plateform after 2015. The current usage metrics is available 48-96 hours after online publication and is updated daily on week days.
Initial download of the metrics may take a while.


