Fig. 5
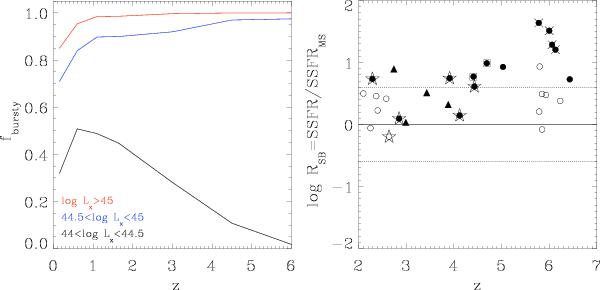
Left: fbursty as a function of z for three different AGN luminosity bins: 44 < log LX/erg s-1 < 44.5, 44.5 < log LX/erg s-1 < 45, and log LX/erg s-1 > 45 from bottom to top. Right: the starburstiness RSB as a function of z of QSOs with Lbol > 1046 erg/s. Triangles: stellar masses from SED fitting (Polletta et al. 2008; Lacy et al. 2011); circles: stellar masses from dynamical masses within the CO emitting region (Wang et al. 2010; Solomon & Vanden Bout 2005; Coppin et al. 2008; Shields et al. 2006; Maiolino et al. 2007; Gallerani 2012) and the [CII] emitting region (crossed circles, Wang et al. 2013). For the sources with [CII] measurements Mdyn are calculated assuming the disk inclination angle estimated from the [CII] minor and major axes ratio (see Wang et al. 2013). Open circles indicate dynamical masses derived assuming a disk radius of 2–2.5 kpc, while filled circles indicate dynamical masses obtained from spatially resolved measurements of the molecular gas emitting region. Squared circles denote sources in which R is measured as half the component separation in merger model (see Shields et al. 2006). Starred circles denote gravitationally lensed QSOs for which the CO and FIR luminosities have been corrected for magnification (Riechers 2011).
Current usage metrics show cumulative count of Article Views (full-text article views including HTML views, PDF and ePub downloads, according to the available data) and Abstracts Views on Vision4Press platform.
Data correspond to usage on the plateform after 2015. The current usage metrics is available 48-96 hours after online publication and is updated daily on week days.
Initial download of the metrics may take a while.