Fig. 4
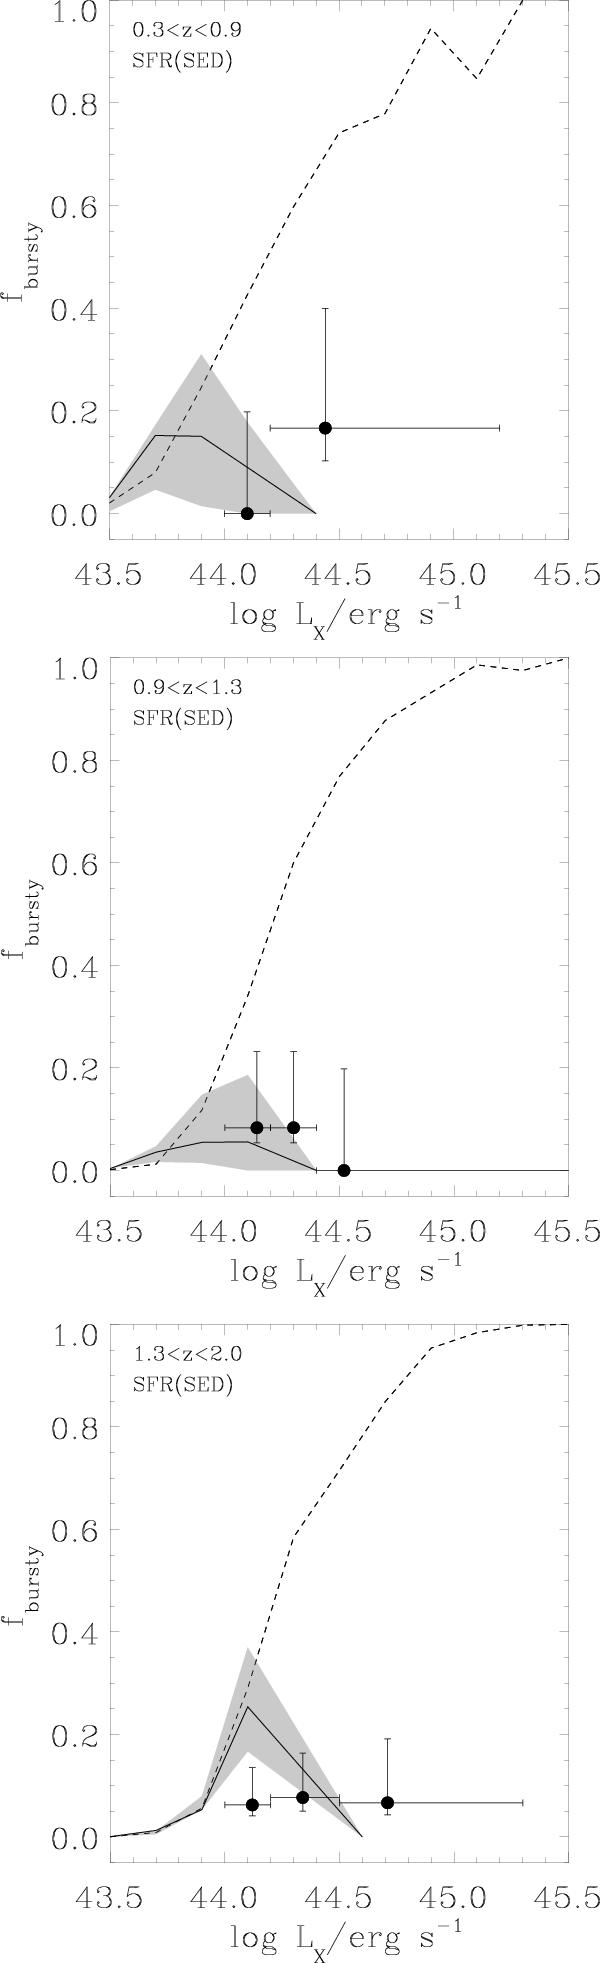
fbursty versus LX in three redshift bins. The solid lines show the model predictions obtained by selecting obscured AGNs with NH > 1022 cm-2 and M∗ ≥ 1010 M⊙. The upper and the lower envelopes of the shaded regions show fbursty corresponding to the selection NH ≥ 1021.8 cm-2 and NH ≥ 1022.2 cm-2, respectively. The dashed lines show the predictions obtained by selecting obscured and unobscured AGNs with M∗ ≥ 1010 M⊙. The data points are derived using the SED-based SFRs and M∗ as computed by Bongiorno et al. (2012). The plotted value of LX is the median value for sources in each luminosity bin. Vertical error bars indicate the 1σ binomial uncertainties. Horizontal error bars indicate the luminosity bin sizes which are optimized to have roughly the same number of sources in each bin.
Current usage metrics show cumulative count of Article Views (full-text article views including HTML views, PDF and ePub downloads, according to the available data) and Abstracts Views on Vision4Press platform.
Data correspond to usage on the plateform after 2015. The current usage metrics is available 48-96 hours after online publication and is updated daily on week days.
Initial download of the metrics may take a while.