Fig. 2
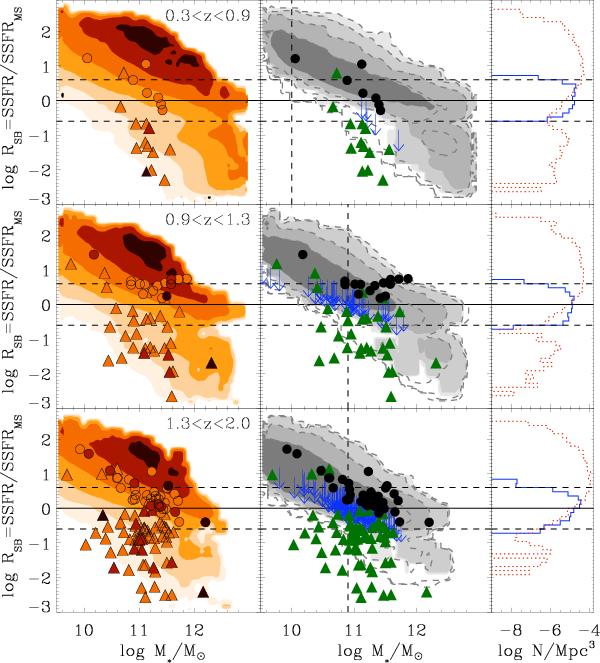
Left and central panels: starburstiness RSB as a function of M∗ in three redshift bins. The filled contours in the left panels correspond to the predicted average values of the AGN X-ray luminosity for bins of different M∗ and RSB. The luminosity values are equally spaced in logarithmic scale from LX = 1042.5 erg/s for the lightest filled region to LX = 1045 erg/s for the darkest. The filled (dotted) contours in the central panel correspond to equally spaced values of the density (per Mpc3) of model AGNs with LX ≥ 1044 erg/s (LX ≥ 1043.8 erg/s) in logarithmic scale: from 10-9 for the lightest filled region to 10-6 for the darkest. The data points indicate the XMM-COSMOS AGNs with LX ≥ 1044 erg/s. Circles and arrows indicate AGNs with SFR derived from LFIR, while triangles indicate AGNs with SFR derived from SED fitting. Circles and triangles are color coded according to their X-ray luminosity in the left panels. Solid lines show the position of the galaxy main sequence, while dashed lines denote the limits of the starburst and passive areas, defined as RSB > 4 and RSB < 1/4, respectively. Vertical dashed lines indicate the stellar mass limits adopted in deriving the fraction of AGN hosted in starburst galaxies in Sect. 4.2. Right panels: starburstiness distribution of model AGNs. The solid histograms refer to galaxies dominated by the quiescent mode of star formation (SFRq > SFRb), while the dotted histograms refer to galaxies dominated by the burst component of star formation (SFRb > SFRq). Solid and dashed lines as in the left panels.
Current usage metrics show cumulative count of Article Views (full-text article views including HTML views, PDF and ePub downloads, according to the available data) and Abstracts Views on Vision4Press platform.
Data correspond to usage on the plateform after 2015. The current usage metrics is available 48-96 hours after online publication and is updated daily on week days.
Initial download of the metrics may take a while.