Free Access
Fig. 5
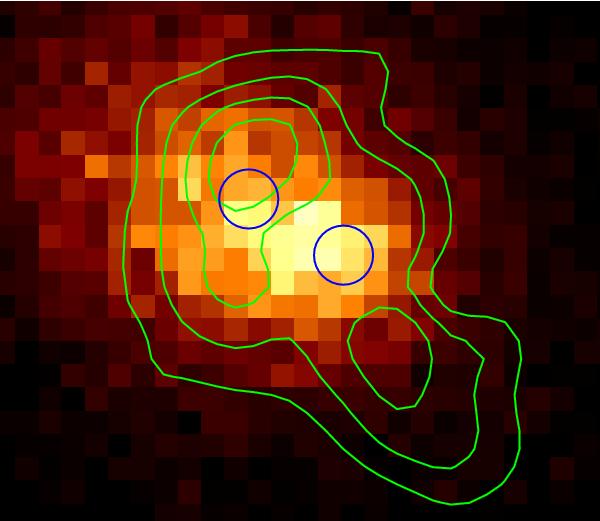
Chandra X-ray map of AS1063 overlaid with the LABOCA residuals in green contours starting at 2σ and spaced by 1σ. The blue circles mark the positions of the two components of the β-model fitted by Gómez et al. (2012) to the Chandra data.
Current usage metrics show cumulative count of Article Views (full-text article views including HTML views, PDF and ePub downloads, according to the available data) and Abstracts Views on Vision4Press platform.
Data correspond to usage on the plateform after 2015. The current usage metrics is available 48-96 hours after online publication and is updated daily on week days.
Initial download of the metrics may take a while.