Fig. 3
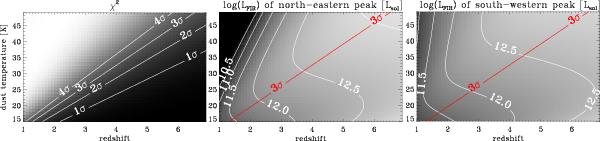
Left panel: χ2 map in the z-Td plane, where z and Td are the redshift and the dust temperature assumed for the 870 μm source detected with LABOCA. The two 870 μm peaks shown in Fig. 2 and the two low-z sources (at z = 0.6 and 0.3) shown in Fig. 1 are fitted simultaneously at all wavelengths from 100 to 870 μm assuming a modified black-body SED for each source (7 free parameters). The white contours show the 1σ, 2σ, 3σ, and 4σ confidence levels. Middle and right panels: best-fit FIR luminosity in log without any lensing correction in the z-Td plane for the two 870 μm peaks. The white contours are spaced by 0.5 dex. The χ2 3σ confidence level is overplotted in red.
Current usage metrics show cumulative count of Article Views (full-text article views including HTML views, PDF and ePub downloads, according to the available data) and Abstracts Views on Vision4Press platform.
Data correspond to usage on the plateform after 2015. The current usage metrics is available 48-96 hours after online publication and is updated daily on week days.
Initial download of the metrics may take a while.