Fig. 2
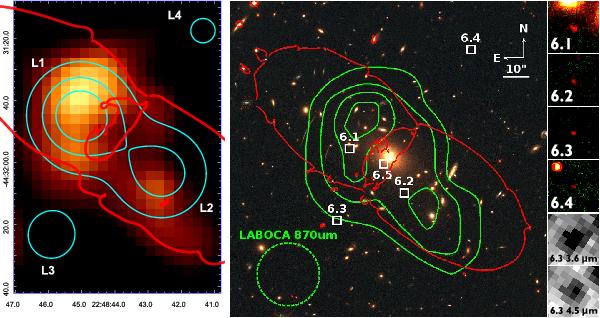
Left: residuals of the 870 μm emission after subtracting the two low-z sources. The cyan contours represent the z = 6 source model lensed by the cluster and observed at the resolution of LABOCA. The four images formed are labeled L1, L2, L3, and L4. The contour levels are at 0.25, 0.5 and 0.75 × SL1, where SL1 is the peak flux of the L1 image. The critical lines for z = 6 are overlaid in red. Right: HST color image of the cluster center of AS1063 assembled from images in the filters F606W (blue), F775W (green) and F125W (red). The white squares show the positions of the 4 images of a z = 6.1 background source. The thumbnails at the right are 3′′ × 3′′ zooms into these 4 images. The green contours show the 870 μm emission at 2.6, 3.9, 5.2, and 6.5 mJy (RMS = 1.1 mJy). The dotted green circle represents the LABOCA beam (FWHM = 24.3′′).
Current usage metrics show cumulative count of Article Views (full-text article views including HTML views, PDF and ePub downloads, according to the available data) and Abstracts Views on Vision4Press platform.
Data correspond to usage on the plateform after 2015. The current usage metrics is available 48-96 hours after online publication and is updated daily on week days.
Initial download of the metrics may take a while.