Fig. 1
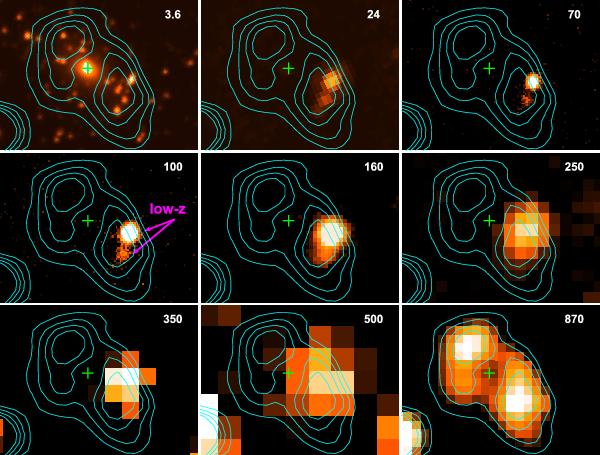
105′′ × 78′′ thumbnails showing the central region of the cluster AS1063 at 3.6, 24, 70, 100, 160, 250, 350, 500, and 870 μm (from left to right and from top to bottom). The contours correspond to the 870 μm emission detected with LABOCA at 3, 4, 5 and 6-σ (σ = 1.1 mJy). The Herschel drop-out source can be seen around the BCG (marked by the green cross) at the center of the 870 μm map. The arrows in the 100 μm map point at two low-z sources (z = 0.3 and 0.6), whose 870 μm emission is blended with the southwestern part of the high-z source.
Current usage metrics show cumulative count of Article Views (full-text article views including HTML views, PDF and ePub downloads, according to the available data) and Abstracts Views on Vision4Press platform.
Data correspond to usage on the plateform after 2015. The current usage metrics is available 48-96 hours after online publication and is updated daily on week days.
Initial download of the metrics may take a while.