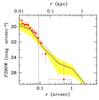
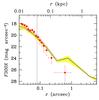
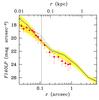
Fig. 3
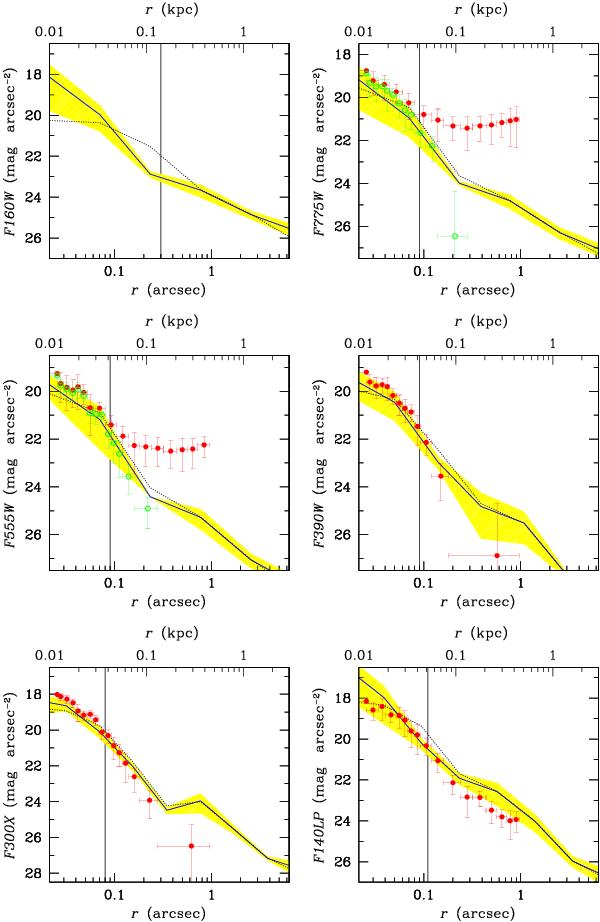
Surface brightness profiles of the HLX-1 counterpart in the simulation (lines) and in the HST observations (circles). From left to right and from top to bottom: filter F160W, F775W, F555W, F390W, F300X, and F140LP. In all panels, solid blue line: simulated profile of the satellite galaxy at t = 100 Myr after the first pericentre passage. We assume AV = 0.18 for the simulation. The dotted black line is the simulated profile convolved with the observed PSF. The yellow shaded area shows the uncertainty in the simulation due to stochastic fluctuations and to spatial resolution (see the text for details). The filled red circles were obtained in M13 by subtracting the background according to the first approach (as described in M13). In the F775W and F555W filters, the open green circles were obtained by subtracting the background according to the second approach, as described in M13. We do not show the observed profile in F160W as the background of the S0 galaxy is much stronger than the flux of the HLX-1 counterpart in this filter. The error bars of the data points are at 1σ. Vertical solid line: PSF full-width at half maximum, as derived in M13.
Current usage metrics show cumulative count of Article Views (full-text article views including HTML views, PDF and ePub downloads, according to the available data) and Abstracts Views on Vision4Press platform.
Data correspond to usage on the plateform after 2015. The current usage metrics is available 48-96 hours after online publication and is updated daily on week days.
Initial download of the metrics may take a while.