Fig. 1
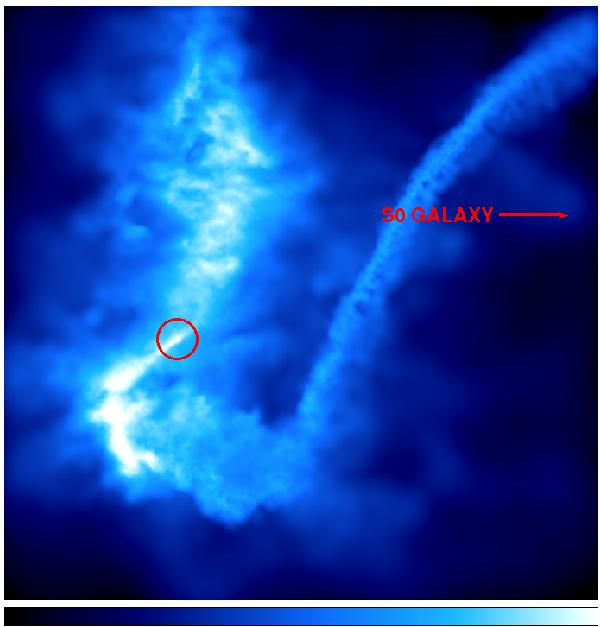
Colour-coded map: projected mass density of gas in the simulated satellite galaxy at t = 100 Myr after the first pericentre passage. The satellite is seen face-on. The scale of the colour-coded map is logarithmic, ranging from 2.2 × 10⁻⁹ M⊙ pc-3 (black) to 2.2 × 10⁻² M⊙ pc-3 (white). The frame size is 60 × 60 kpc. The red circle marks the position of the nucleus of the satellite galaxy. The direction of the S0 bulge is indicated by the red arrow.
Current usage metrics show cumulative count of Article Views (full-text article views including HTML views, PDF and ePub downloads, according to the available data) and Abstracts Views on Vision4Press platform.
Data correspond to usage on the plateform after 2015. The current usage metrics is available 48-96 hours after online publication and is updated daily on week days.
Initial download of the metrics may take a while.