Fig. A.1
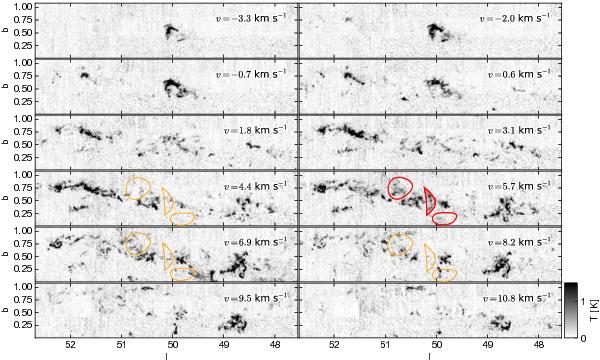
Channel maps of the GRS (Jackson et al. 2006) 13CO(1–0) emission of the region. The contaminating gas has a narrow (~0.5kms-1) line width, and is detected only in single channels in the map. Some contamination from local clouds is indicated with red circles as examples, and these red circles are also plotted in yellow in the adjacent velocity channels for comparison.
Current usage metrics show cumulative count of Article Views (full-text article views including HTML views, PDF and ePub downloads, according to the available data) and Abstracts Views on Vision4Press platform.
Data correspond to usage on the plateform after 2015. The current usage metrics is available 48-96 hours after online publication and is updated daily on week days.
Initial download of the metrics may take a while.