Fig. 2
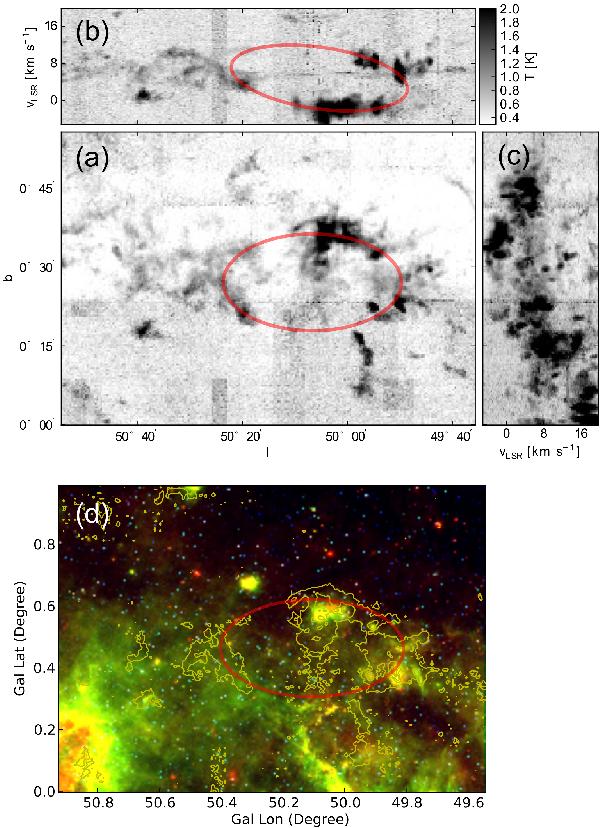
a) Galactic longitude-latitude map of the peak temperatures of the 13CO(1–0) data cube along the velocity axis. b) Galactic-longitude-velocity map of peak temperatures of 13CO(1–0) along the galactic latitude axis. c) Velocity-galactic-latitude map of peak temperatures of 13CO(1–0) along the galactic longitude axis. d)Spitzer GLIMPSE (Benjamin et al. 2003) and MIPSGAL (Carey et al. 2009) three-color image of the region. Red: 24 μm, Green: 8 μm, Blue: 3.6 μm. Overlaid contours are the velocity-integrated 13CO(1–0) emission from the Galactic Ring Survey (Jackson et al. 2006) (− 4.95 km s-1 < vlsr < 17.36 km s-1). Contours correspond to 3.5, 7.3, 11.2, 15 K km s-1. In a) b), and d), the bubble is indicated as a red ellipse.
Current usage metrics show cumulative count of Article Views (full-text article views including HTML views, PDF and ePub downloads, according to the available data) and Abstracts Views on Vision4Press platform.
Data correspond to usage on the plateform after 2015. The current usage metrics is available 48-96 hours after online publication and is updated daily on week days.
Initial download of the metrics may take a while.