Fig. 1
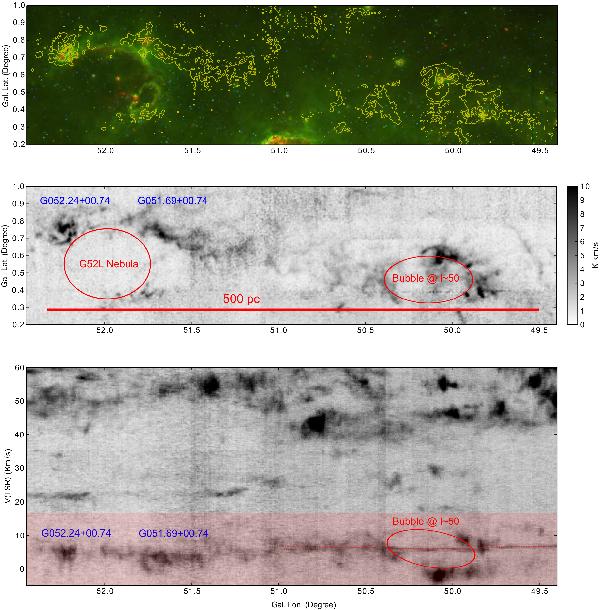
Top panel: Spitzer GLIMPSE (Benjamin et al. 2003) and MIPSGAL (Carey et al. 2009) three-color image of the region. Red: 24 μm, green: 8 μm, blue: 3.6 μm. Overlaid contours are the velocity-integrated 13CO(1-0) emission (− 5.0kms-1 < vlsr < 17.4kms-1) from the Galactic Ring Survey (Jackson et al. 2006). Contours correspond to 3.5, 7.3, 11.2, 15 Kkms-1. Middle panel: velocity-integrated 13CO(1–0) map of the region integrated within − 4.95kms-1 < vlsr < 17.36kms-1. A scale bar of 500 pc is added assuming a kinematic distance of 9.8kpc. Bottom panel: Galactic-latitude-integrated 13CO(1–0) position-velocity map of the region (integrated from − 0.2° < b < 1°). The clouds G052.24+00.74, G051.69+00.74, the bubble at l ~ 50°, and the G52L nebula (Bania et al. 2012) are indicated in the middle and bottom panels. The velocity range we used to produce the 13CO(1–0) integrated intensity map is indicated in the bottom panel as the red shaded region. The emission at 5.2kms-1 < vlsr < 7.2kms-1 is due to contamination from a different molecular cloud, and some of the emission lies on the red dashed line. This component has a smaller line width ≲0.5kms-1, which implies that the contamination comes from a close-by cloud. This is supported by its apparent diffuse morphology. Channel maps of the region are provided in Appendix A.
Current usage metrics show cumulative count of Article Views (full-text article views including HTML views, PDF and ePub downloads, according to the available data) and Abstracts Views on Vision4Press platform.
Data correspond to usage on the plateform after 2015. The current usage metrics is available 48-96 hours after online publication and is updated daily on week days.
Initial download of the metrics may take a while.