Fig. 8
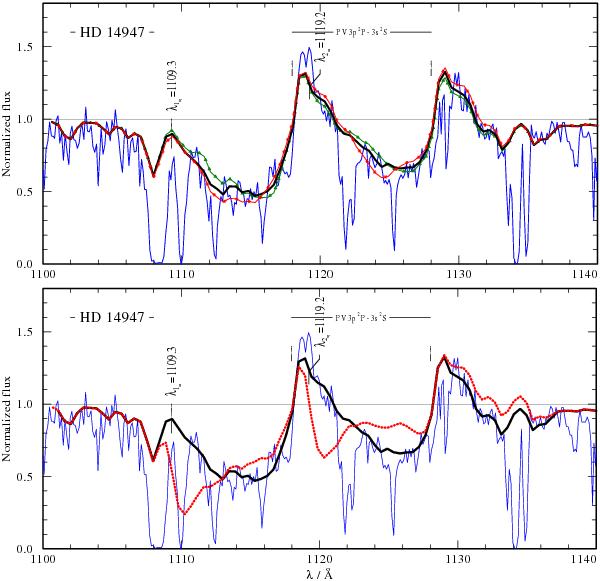
Upper panel: effects of the “vorosity” on the P v profile. All three calculations are for L0 = 0.5 and d = 0.2. The green line with triangles shows the profile for m = 0.01, the red line with asterisk for m = 0.3, and the thick solid black line for m = 0.1. Lower panel: P v line profiles calculated with standard β-law and constant ionization fraction qP v = 1 (dotted-red line), compared to the simulation with double-β law and the ionization stratification from the corresponding PoWR model (thick solid black line). Both profiles are calculated for L0 = 0.5, d = 0.2, rcl = 1, and m = 0.1. The thin solid blue lines in the panels are the observed spectrum. λ1∞ and λ2∞ represent the wavelength associated with the assumed ν∞.
Current usage metrics show cumulative count of Article Views (full-text article views including HTML views, PDF and ePub downloads, according to the available data) and Abstracts Views on Vision4Press platform.
Data correspond to usage on the plateform after 2015. The current usage metrics is available 48-96 hours after online publication and is updated daily on week days.
Initial download of the metrics may take a while.