Fig. 7
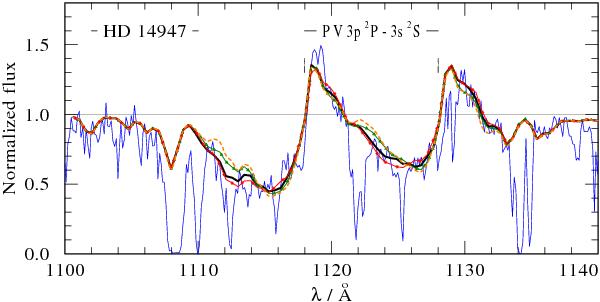
Dependence of the P v profile on the clumping factor D. All four calculations are for rcl = 1, L0 = 0.5, d = 0.2, and m = 0.1. The thick solid black line is for our standard value D = 10. The red line with asterisks shows the profile for D = 5, the green line with triangles for D = 50, and the dashed orange line for D = 400. The thin solid blue line is the observed spectrum.
Current usage metrics show cumulative count of Article Views (full-text article views including HTML views, PDF and ePub downloads, according to the available data) and Abstracts Views on Vision4Press platform.
Data correspond to usage on the plateform after 2015. The current usage metrics is available 48-96 hours after online publication and is updated daily on week days.
Initial download of the metrics may take a while.