Fig. 6
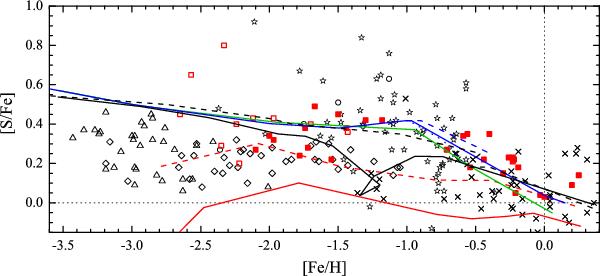
Comparison with theoretical models of Galactic chemical evolution. The symbols corresponding to previous studies are the same as in Fig. 5. Our results are plotted with solid and empty red squares. The red solid and dashed lines correspond to the Timmes et al. (1995) nominal model and one where the iron yields are reduced by a factor of two, respectively. The green line is the prediction of Kobayashi et al. (2006) for the solar neighbourhood. The dotted, solid and dashed blue lines correspond to halo, solar neighbourhood, and thick disk models of Kobayashi et al. (2011), respectively. The solid and dashed black lines correspond to the Brusadin et al. (2013) double-infall model with and without outflow, respectively.
Current usage metrics show cumulative count of Article Views (full-text article views including HTML views, PDF and ePub downloads, according to the available data) and Abstracts Views on Vision4Press platform.
Data correspond to usage on the plateform after 2015. The current usage metrics is available 48-96 hours after online publication and is updated daily on week days.
Initial download of the metrics may take a while.