Fig. 9
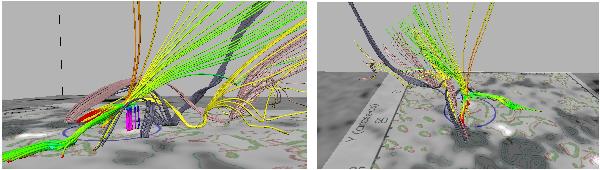
Visualization of three field line sets that go through the bald patches to the north-east of p3 (in dark gray, yellow, and light magenta). The two panels show different perspectives of the same field lines. The bottom plane contains a superposition of the NLFFF magnetogram and the image of Fig. 7. To facilitate identification, the field line set visible in the bottom panels of Fig. 8 that is colored according to the value of Bz is repeated here.
Current usage metrics show cumulative count of Article Views (full-text article views including HTML views, PDF and ePub downloads, according to the available data) and Abstracts Views on Vision4Press platform.
Data correspond to usage on the plateform after 2015. The current usage metrics is available 48-96 hours after online publication and is updated daily on week days.
Initial download of the metrics may take a while.