Fig. 7
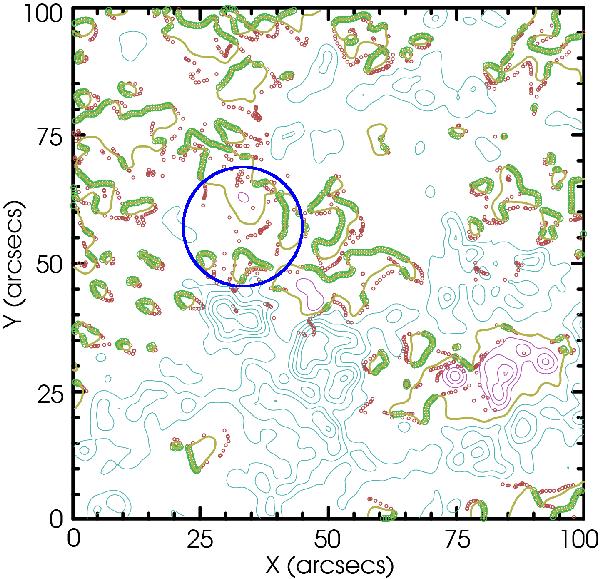
Bald patches (green circles) computed from the NLFFF field model. Dark red circles represent the footpoints of the bald patch field lines. Magenta/cyan solid lines denote the contours of the positive/negative polarity. The olive-green solid line indicates the polarity inversion line, where all the bald patches are located. The blue circle in this figure is the same as shown in Fig. 5 and marks the region from where Jet 2 is launched.
Current usage metrics show cumulative count of Article Views (full-text article views including HTML views, PDF and ePub downloads, according to the available data) and Abstracts Views on Vision4Press platform.
Data correspond to usage on the plateform after 2015. The current usage metrics is available 48-96 hours after online publication and is updated daily on week days.
Initial download of the metrics may take a while.