Fig. 5
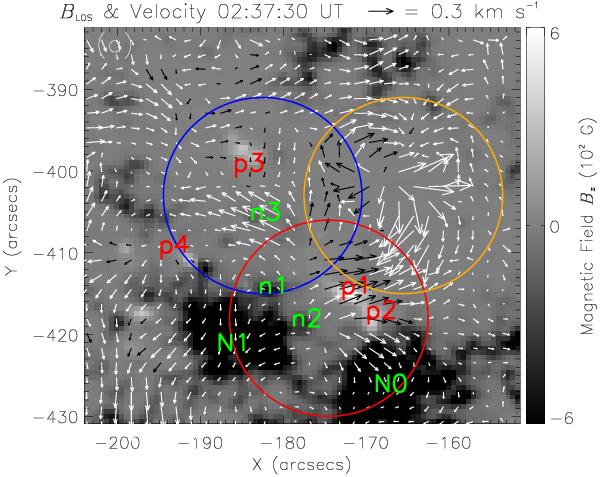
Photospheric transverse velocity derived through LCT analysis of the SDO/HMI magnetograms. The background is the average line-of-sight magnetic field with positive (white) and negative (black) polarities. Arrows represent the transverse velocity, where black/white is located on the positive/negative polarity. The time interval for averaging the line-of-sight magnetic field is 02:25–02:50 UT.
Current usage metrics show cumulative count of Article Views (full-text article views including HTML views, PDF and ePub downloads, according to the available data) and Abstracts Views on Vision4Press platform.
Data correspond to usage on the plateform after 2015. The current usage metrics is available 48-96 hours after online publication and is updated daily on week days.
Initial download of the metrics may take a while.