Fig. 2
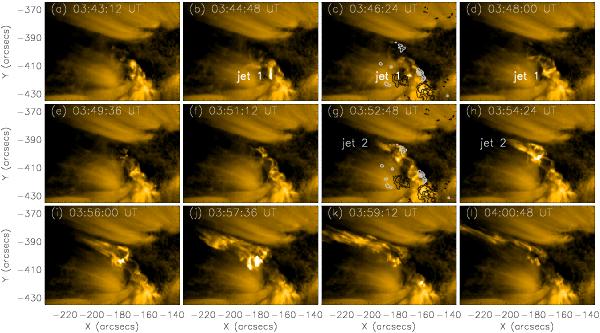
SDO/AIA 171 Å images showing the evolution of two EUV jets. The color scale is the same as in Fig. 1. The labels jet 1 and jet 2 denote the two jets close to each other both in time and space. Grey/black lines in panels c) and g) represent positive/negative polarities of the line-of-sight magnetic field at 03:56:51 UT. The contour levels of BLOS are −1200, −900, −600, 50, 300, and 600 G.
Current usage metrics show cumulative count of Article Views (full-text article views including HTML views, PDF and ePub downloads, according to the available data) and Abstracts Views on Vision4Press platform.
Data correspond to usage on the plateform after 2015. The current usage metrics is available 48-96 hours after online publication and is updated daily on week days.
Initial download of the metrics may take a while.