Fig. 1
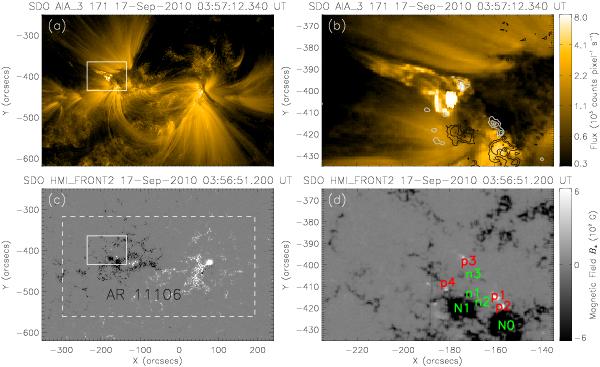
SDO/AIA 171 Å image and SDO/HMI line-of-sight magnetic field. a)A jet in 171 Å observed by SDO/AIA at 03:57 UT. The solid box indicates the field of view of panels b) and d). b) The same 171 Å image as that in panel a) but in a smaller field of view. Gray/black lines represent positive/negative polarities of the line-of-sight magnetic field as shown in panels c) and d). The contour levels of BLOS are −1200, −900, −600, 50, 300, and 600 G. c) Line-of-sight magnetic field of the active region observed by SDO/HMI at 03:56 UT. The solid box is the same as in panel a). The dashed box indicates the field of view used for removing the 180° ambiguity and the projection effect. d) The same line-of-sight magnetic field as in panel c), but in a smaller field of view. Mixed parasitic polarities are denoted by p1, p2, p3, and p4 for positive polarities and n1, n2, and n3 for negative polarities. N0 and N1 denote the main negative polarities in the following part of the active region.
Current usage metrics show cumulative count of Article Views (full-text article views including HTML views, PDF and ePub downloads, according to the available data) and Abstracts Views on Vision4Press platform.
Data correspond to usage on the plateform after 2015. The current usage metrics is available 48-96 hours after online publication and is updated daily on week days.
Initial download of the metrics may take a while.