Free Access
Fig. 26
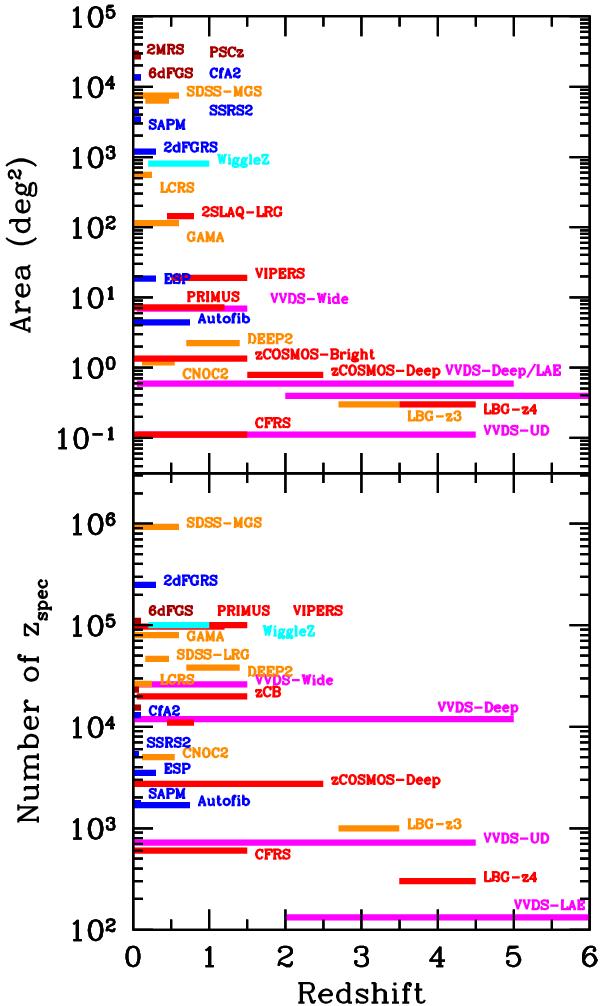
Comparison of the covered area (top) and the number of measured spectroscopic redshifts (bottom) versus redshift, between the VVDS (magenta) and different spectroscopic redshift surveys. The same colour code as in Fig. 24 has been used.
Current usage metrics show cumulative count of Article Views (full-text article views including HTML views, PDF and ePub downloads, according to the available data) and Abstracts Views on Vision4Press platform.
Data correspond to usage on the plateform after 2015. The current usage metrics is available 48-96 hours after online publication and is updated daily on week days.
Initial download of the metrics may take a while.