Fig. 24
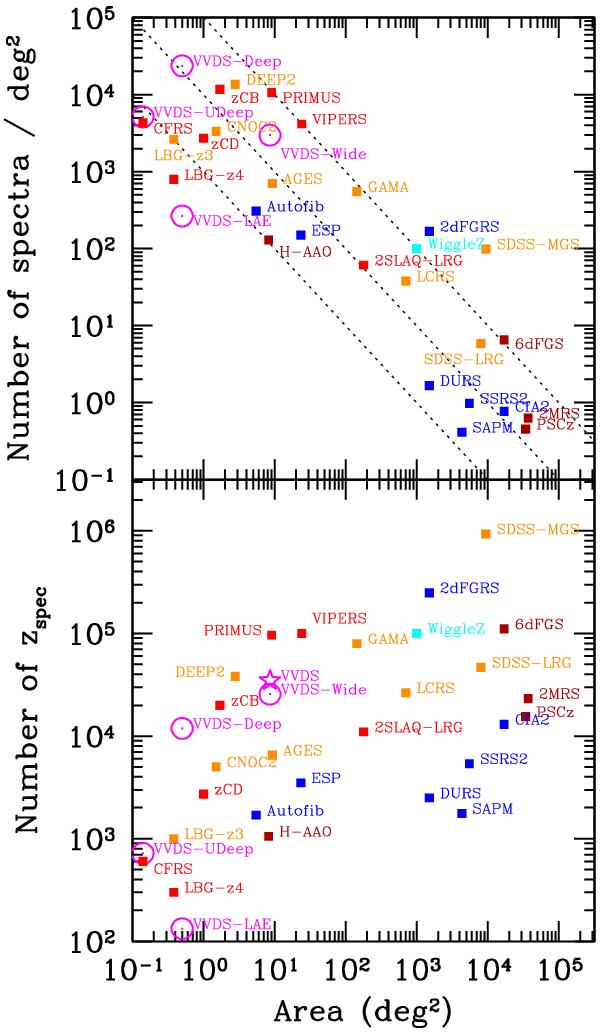
Comparison of the density of spectra (top) and the number of measured spectroscopic redshifts (bottom) versus the observed area for the VVDS (magenta) and different spectroscopic redshift surveys. The combined VVDS surveys (Wide, Deep, and Ultra-Deep) are represented by the star symbol (bottom panel). The colour code indicates the wavelength of the sample selection: UV (cyan), B-band (blue), r-band (orange), i-band (red, magenta), IR (brown). zCOSMOS-Bright and zCOSMOS-Deep are labelled “zCB” and “zCD”, respectively. Dashed lines in the top panel represent samples with 1000, 10 000, and 100 000 redshifts (from bottom to top).
Current usage metrics show cumulative count of Article Views (full-text article views including HTML views, PDF and ePub downloads, according to the available data) and Abstracts Views on Vision4Press platform.
Data correspond to usage on the plateform after 2015. The current usage metrics is available 48-96 hours after online publication and is updated daily on week days.
Initial download of the metrics may take a while.