Fig. 18
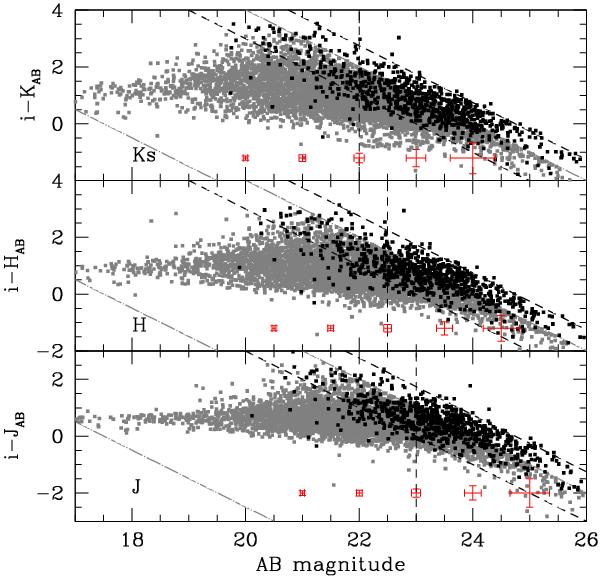
NIR colour–magnitude diagram for J,H, and Ks selected samples obtained from the Ultra-Deep sample (black points). The two oblique dashed lines correspond to the I-band limiting magnitudes of the survey iAB = 23 on the bright end, iAB = 24.75 on the faint end. The VVDS-Deep colour–magnitude distribution is shown as the grey points with the iAB = 17.5 and iAB = 24 limits indicated as long-dashed lines. We are able to extract samples that are nearly complete in spectroscopic redshift measurements, selected down to JAB = 23, HAB = 22.5, and KsAB = 22 (vertical dashed lines). The faint i-band magnitude cut imposes a loss of red objects for fainter magnitudes but it is still 80% complete down to JAB = 24, HAB = 23.5, and KsAB = 23. Typical error bars are shown at the bottom of each panel.
Current usage metrics show cumulative count of Article Views (full-text article views including HTML views, PDF and ePub downloads, according to the available data) and Abstracts Views on Vision4Press platform.
Data correspond to usage on the plateform after 2015. The current usage metrics is available 48-96 hours after online publication and is updated daily on week days.
Initial download of the metrics may take a while.