Fig. 14
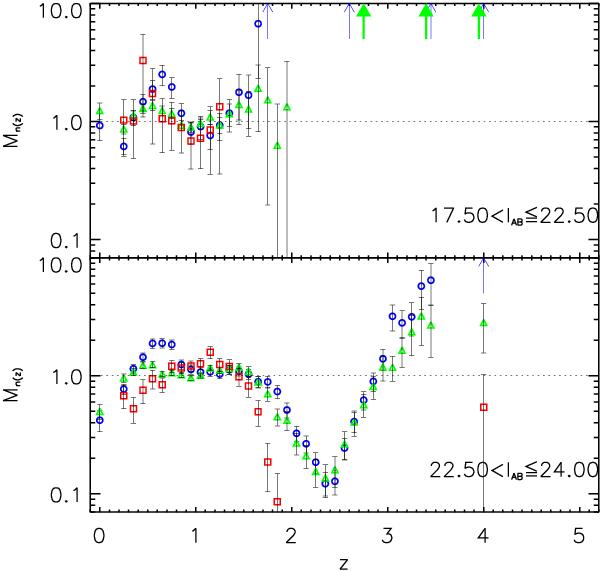
Modulation Mn(z) of the redshift distribution of flag = 1 (blue circles), flag = 2 (green triangles) and flag = 9 (red squares) galaxies. See text for the definition. The two panels represent two magnitude ranges, as indicated in the labels. Arrows indicate when the value of Mn(z) is higher than 10: for z > 1.7 in 17.5 ≤ IAB ≤ 22.5 and for z > 3.5 in 22.5 ≤ IAB ≤ 24 for flag = 1 (thin blue arrows), and for z > 2.7 in 17.5 ≤ IAB ≤ 22.5 for flag = 2 galaxies (thick green arrows). We do not have flag = 9 galaxies for z > 1.5 in 17.5 ≤ IAB ≤ 22.5 and for 2 < z < 3.5 in 22.5 ≤ IAB ≤ 24.
Current usage metrics show cumulative count of Article Views (full-text article views including HTML views, PDF and ePub downloads, according to the available data) and Abstracts Views on Vision4Press platform.
Data correspond to usage on the plateform after 2015. The current usage metrics is available 48-96 hours after online publication and is updated daily on week days.
Initial download of the metrics may take a while.