Fig. 11
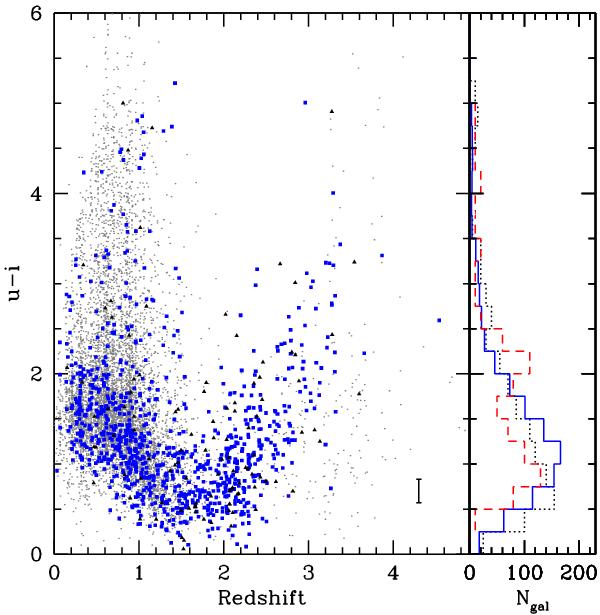
Observed u − i colour distribution vs. redshift of the lowest reliability population (flags 1, black squares) compared to the distribution of galaxies with reliable redshifts (blue squares) for the Ultra-Deep 23 ≤ iAB ≤ 24.75 sample. The distribution of colours vs. redshift in the Deep sample is shown in grey, and the typical u − i error bar is shown on the lower right corner. The projected colour distribution is shown on the right panel as the blue histogram for reliable redshifts (2,3,4,9), the black dotted histogram for the lowest reliability population (flags 1) multiplied by 10 for comparison, and the red dashed histogram for the population of failed redshifts (flags 0) multiplied by 20 for comparison.
Current usage metrics show cumulative count of Article Views (full-text article views including HTML views, PDF and ePub downloads, according to the available data) and Abstracts Views on Vision4Press platform.
Data correspond to usage on the plateform after 2015. The current usage metrics is available 48-96 hours after online publication and is updated daily on week days.
Initial download of the metrics may take a while.