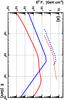
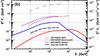
Fig. 8

a) Expected muon neutrino spectra of the most promising burst GRB 110918 (solid lines) from NeuCosmA (Hümmer et al. 2010) (red) and Guetta et al. (2004) (blue). Limits on these predictions are shown in the energy ranges where we expect 90% of the flux (dashed lines). b) Sum of the 296 individual gamma-ray-burst muon neutrino spectra (red and blue solid lines) and limits set by this analysis on the total flux expected from the sample (red and blue dashed lines). The IceCube IC 40+IC 59 limit (Abbasi et al. 2012) on the neutrino emission from 300 GRBs and the first ANTARES limit from 2007 using 40 GRBs (Adrián-Martínez et al. 2013) are also shown in black (dashed) and grey (dash-dotted), respectively. The right-hand axis represents the inferred quasi-diffuse flux limit E2Φν (Eq. (8)).
Current usage metrics show cumulative count of Article Views (full-text article views including HTML views, PDF and ePub downloads, according to the available data) and Abstracts Views on Vision4Press platform.
Data correspond to usage on the plateform after 2015. The current usage metrics is available 48-96 hours after online publication and is updated daily on week days.
Initial download of the metrics may take a while.