Fig. 7
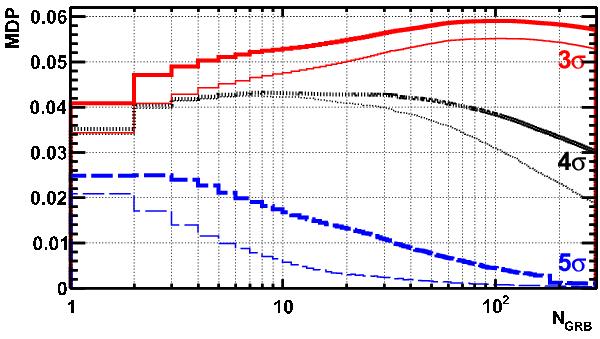
Model discovery potential  versus the number of GRBs in an optimised sub-sample, NGRB, for 3σ, 4σ, and 5σ in red solid, black dotted, and blue dashed lines. For each sub-sample, only the NGRB bursts with the best
  at the given trial factor NGRB are chosen. The thick lines show the distributions of the likelihood method used in this analysis, the thin lines show the distributions for a simple counting search with fixed quality cuts Λ > − 5.5, β < 1° (see text).
Current usage metrics show cumulative count of Article Views (full-text article views including HTML views, PDF and ePub downloads, according to the available data) and Abstracts Views on Vision4Press platform.
Data correspond to usage on the plateform after 2015. The current usage metrics is available 48-96 hours after online publication and is updated daily on week days.
Initial download of the metrics may take a while.