Fig. 4
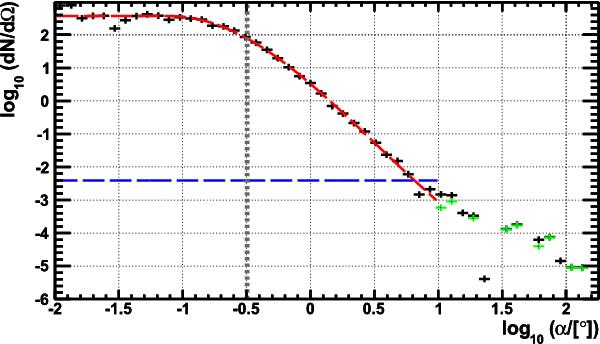
Simulated and reconstructed signal events per solid angle Ω versus the logarithm of the space angle α in degrees for the burst GRB 110918: muon tracks are plotted in black, shower-like events are drawn in green. The corresponding fit is shown in red (see Eq. (1)). The grey dotted line indicates the median angular spread of events ⟨ α ⟩ = 0.32°. The blue dashed line shows the flat background distribution ℬ(α) as calculated in Sect. 6. Cut values Λ > − 5.5 and β < 1° are applied here.
Current usage metrics show cumulative count of Article Views (full-text article views including HTML views, PDF and ePub downloads, according to the available data) and Abstracts Views on Vision4Press platform.
Data correspond to usage on the plateform after 2015. The current usage metrics is available 48-96 hours after online publication and is updated daily on week days.
Initial download of the metrics may take a while.