Fig. 3
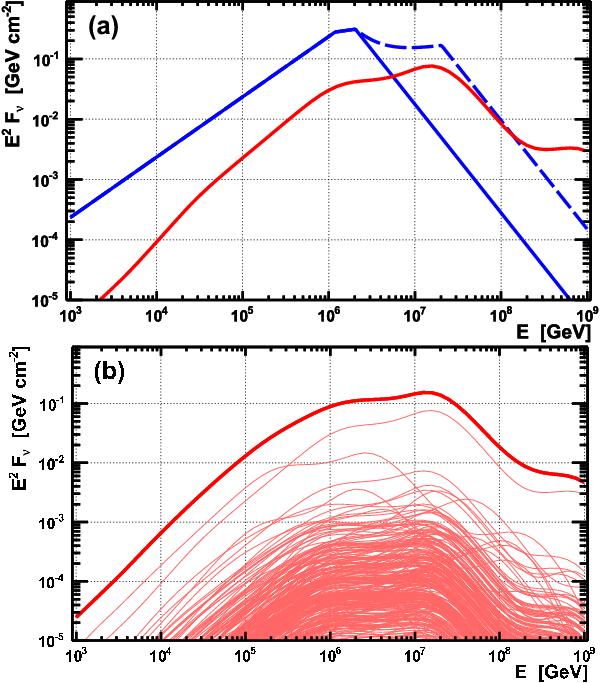
a) Expected  spectra of GRB 110918. The analytic model of Guetta et al. (2004) (blue) is shown with the usual simple treatment (blue solid) and accounting for different break energies of νμ and
  (blue dashed). The numerical NeuCosmA prediction is presented in red. b) Individual NeuCosmA spectra of the 296 GRBs (thin lines) and their sum (thick line).
Current usage metrics show cumulative count of Article Views (full-text article views including HTML views, PDF and ePub downloads, according to the available data) and Abstracts Views on Vision4Press platform.
Data correspond to usage on the plateform after 2015. The current usage metrics is available 48-96 hours after online publication and is updated daily on week days.
Initial download of the metrics may take a while.